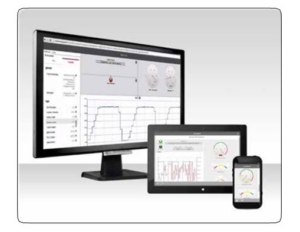
Make more use of the data you already collect. Find new information to improve operations.
What if key decision makers had real-time production information in a dashboard, trend, report, or key performance indicator (KPI) on a mobile device or computer web browser updated continually and available any time? And, what if that decision maker was notified when production parameters moved outside their pre-set limits? More informed decisions, utilizing real-time data, on mobile devices or desktops becomes a standard process in your improved operations. Think about the alternative of the time spent preparing simple reports. Hours and days can be spent collecting relevant data from disparate systems, which then needs to be routed and analyzed before production decisions can be made.
Only VantagePoint correlates, and normalizes disparate data from your manufacturing and production processes and business systems in a Unified Production Model (UPM). It then enables you to organize and present information in everyday language — tailored to users’ needs on mobile devices or desktops.
VantagePoint EMI helps solve many of the delays associated with typical manufacturing reporting. Delays and inaccuracies that can develop as users find and pull relevant data from various manufacturing and production systems, put them into spreadsheets – then rationalizing, correlating and disseminating the results. And by the time anyone gets around to reading these reports, the information is stale.
At worst, intended recipients don’t bother and they miss important information – information they need to increase productivity and reduce cost.
Problem Solved
By organizing all data sources in a Unified Production Model, bridges are created between multiple systems, vendors
and data types. Data in the model can be accessed from anywhere, by anyone in real world terminology, not obscure PLC addresses or unknown historian variable names. This data can then be presented as information relevant to the user’s role and responsibility within the organization. For example:
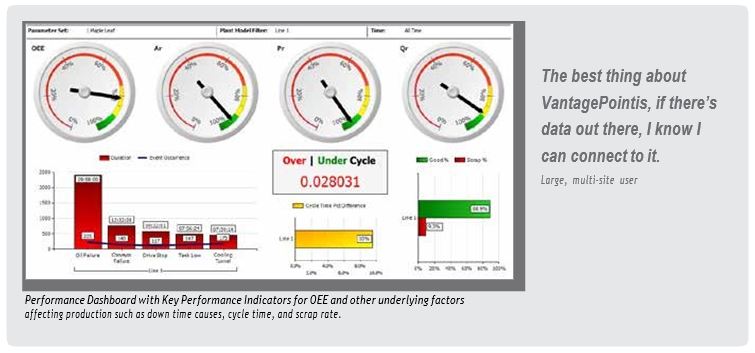
- Machine operators can see machine-level information, such as a dashboard that includes OEE gauges, time, fault and part analysis, OEE by hour with a target including a tabular event detail list
- Plant managers can view plant-level Key Performance Indicators like a Production Scorecard – replacing a manual production summary that most of them update manually
- Operations executives can see enterprise-wide reports, for example a plant-to-plant comparison of real-time production and financial performance
Everyone has access to the information needed to make timely decisions.
Take the Cost Out of Connectivity
- Control loop reports
- Device and equipment reports


